NYC Housing Development Corporation
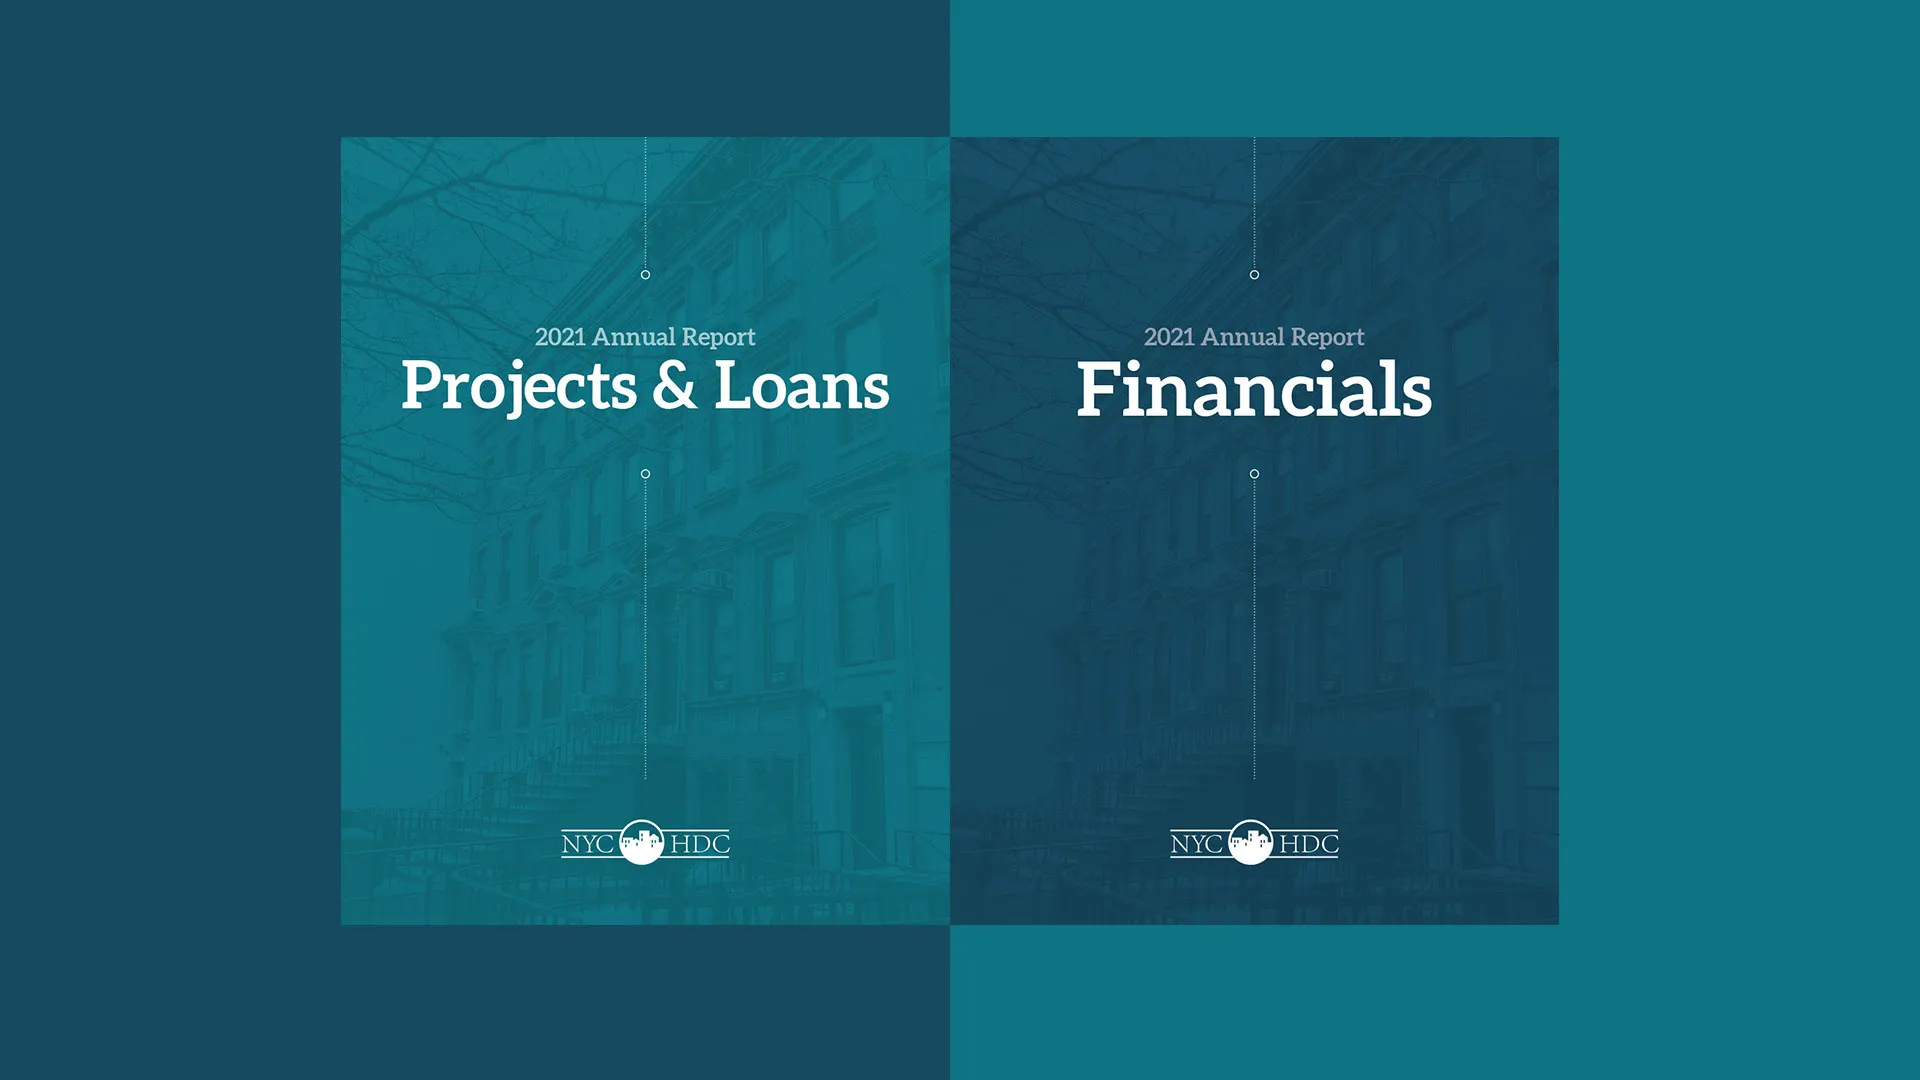
2021 Digital Annual Report (50th Anniversary)
What Matters
- Turned 50 years of impact into an interactive timeline that made HDC’s role in shaping the city easy to understand
- Made decades of financial, policy, and development history accessible through a clear, navigable structure
- Let users quickly explore and compare milestones across time with a persistent, easy-to-use timeline navigation
- Brought institutional history to life through archival content, data, and audio
A 50-Year Story of Impact
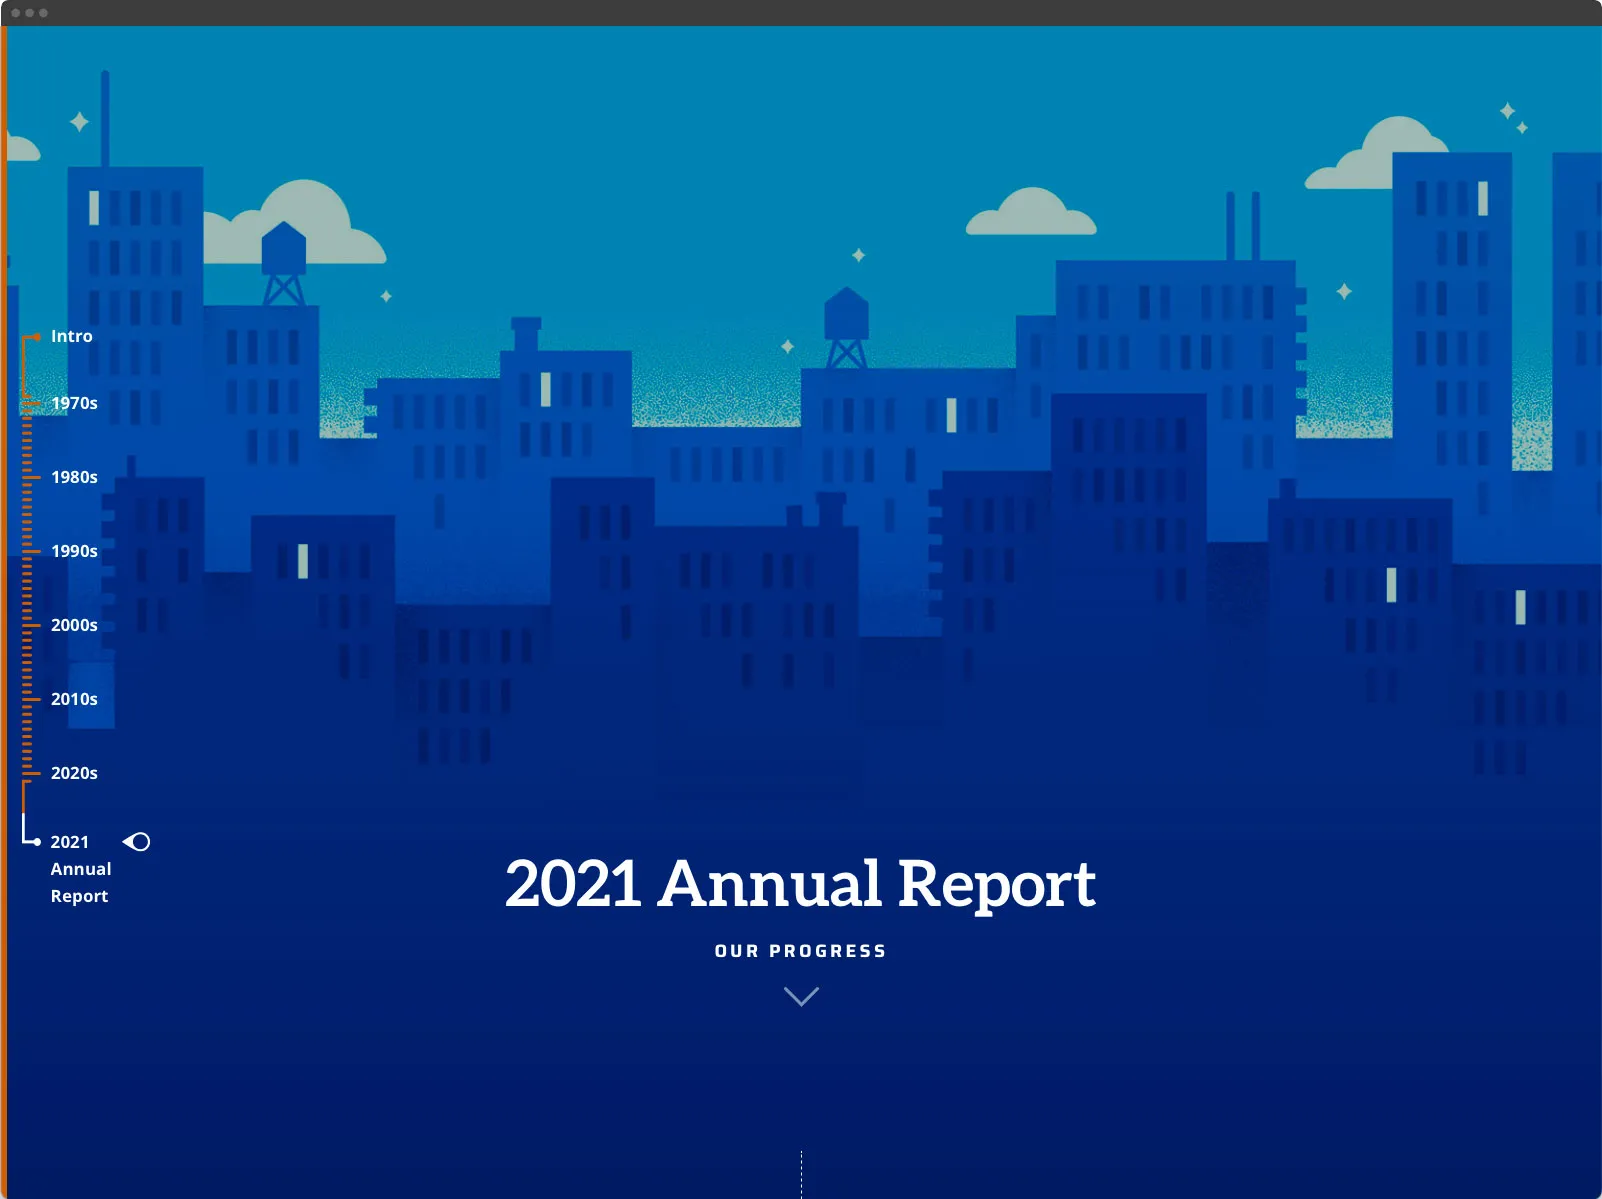
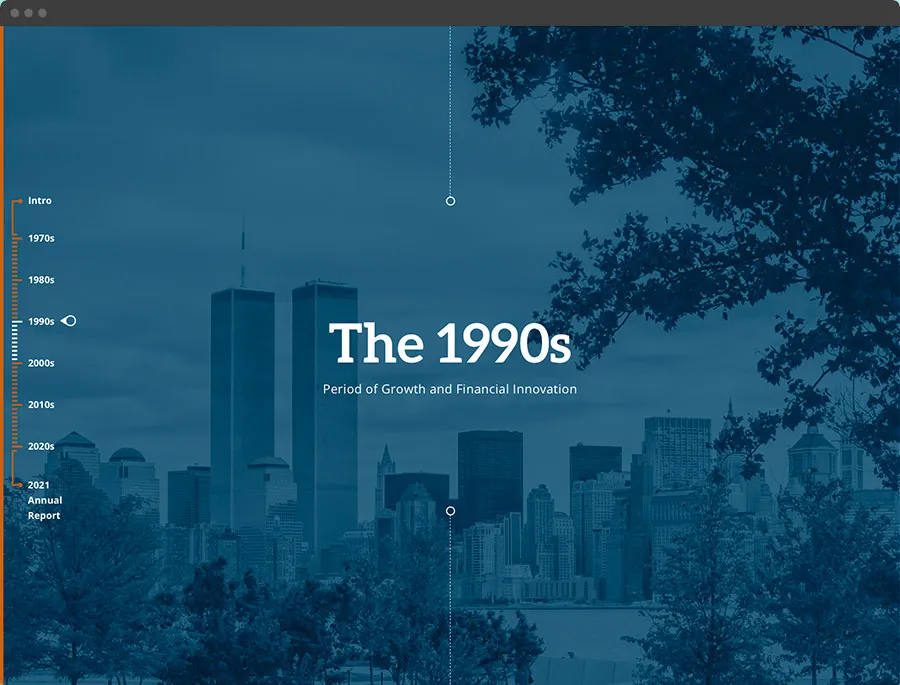
As HDC marked 50 years of financing affordable housing, the report needed to do more than summarize a single year. It had to tell the story of how the organization helped shape New York City over time. We designed the experience as a chronological journey, guiding users through each decade while connecting financial innovation, policy shifts, and development activity to the city’s broader evolution.
Structuring a Navigable Timeline
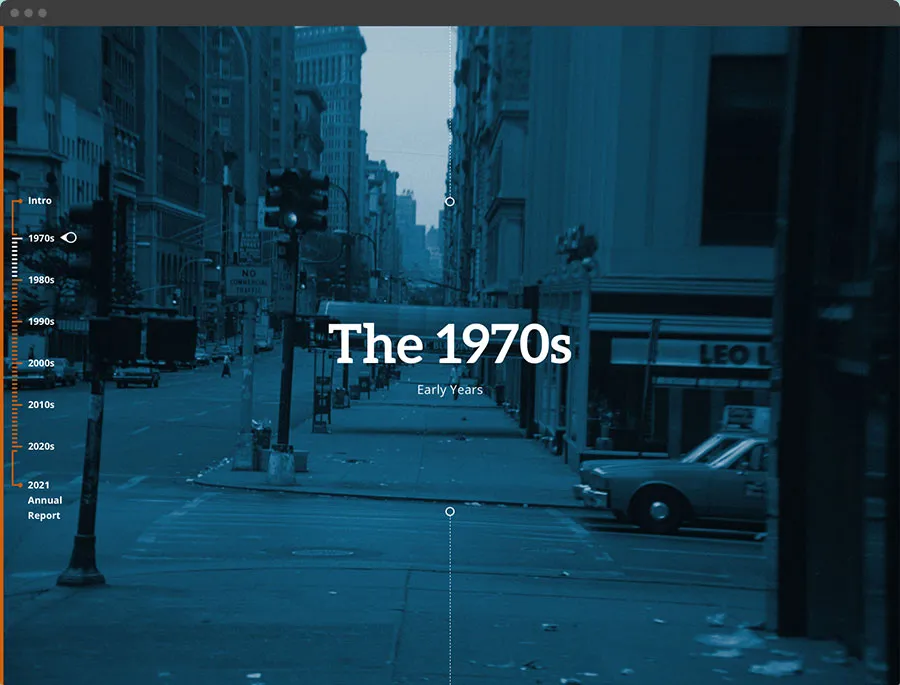
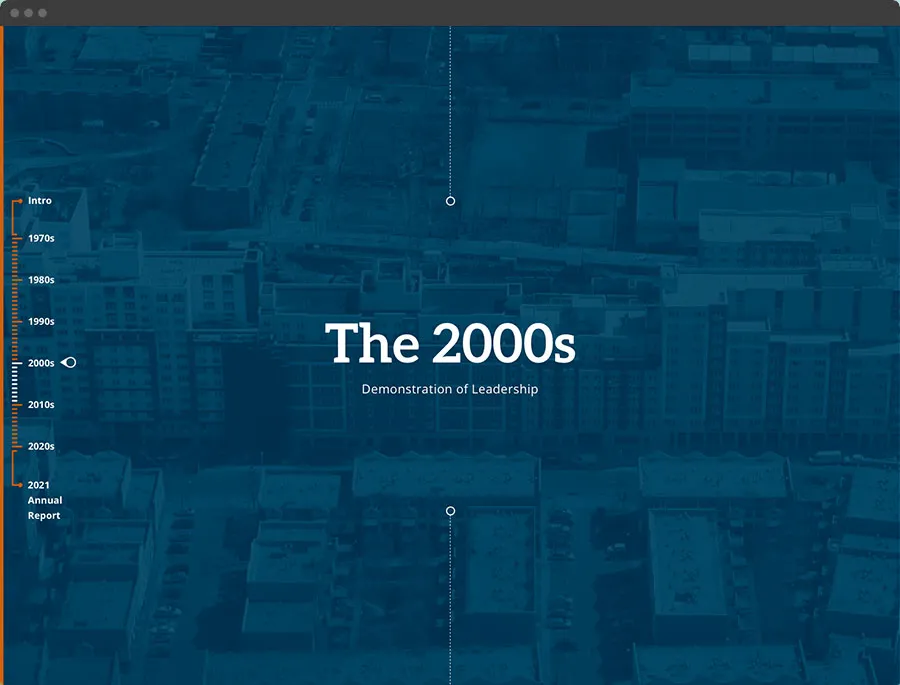
The report is built as an interactive timeline that users can both scroll through and directly navigate. A persistent timeline on the left allows visitors to jump between decades—from the early bond issuances of the 1970s to more recent financial milestones—making a large body of history feel accessible and easy to explore.
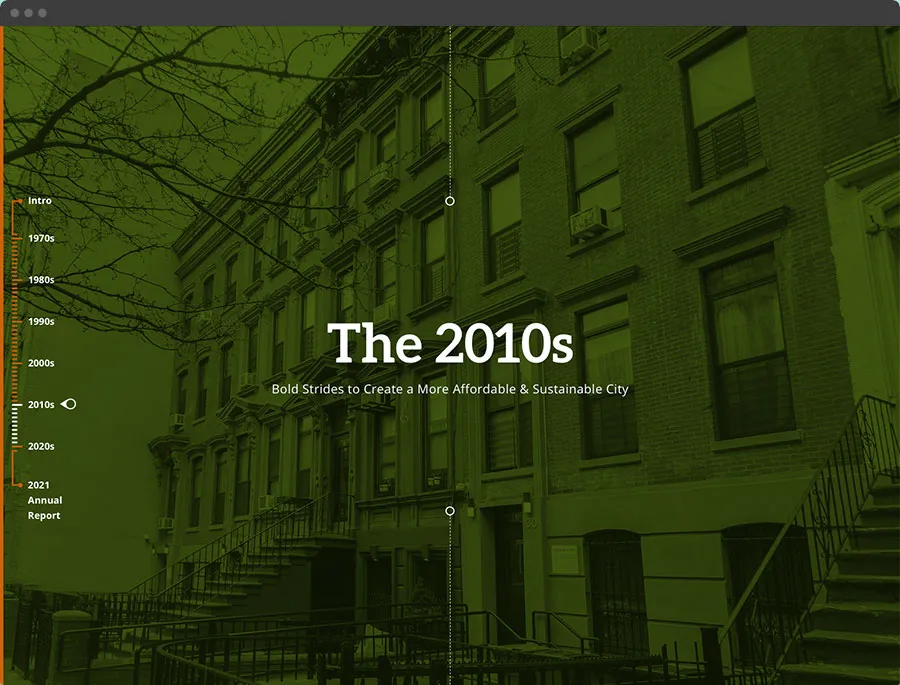
Each section combines historical context with measurable outcomes, pairing moments like fiscal crises, policy changes, and major financings with data that shows their impact. Archival imagery, milestone callouts, and integrated media create a rhythm that keeps the experience engaging without sacrificing clarity.

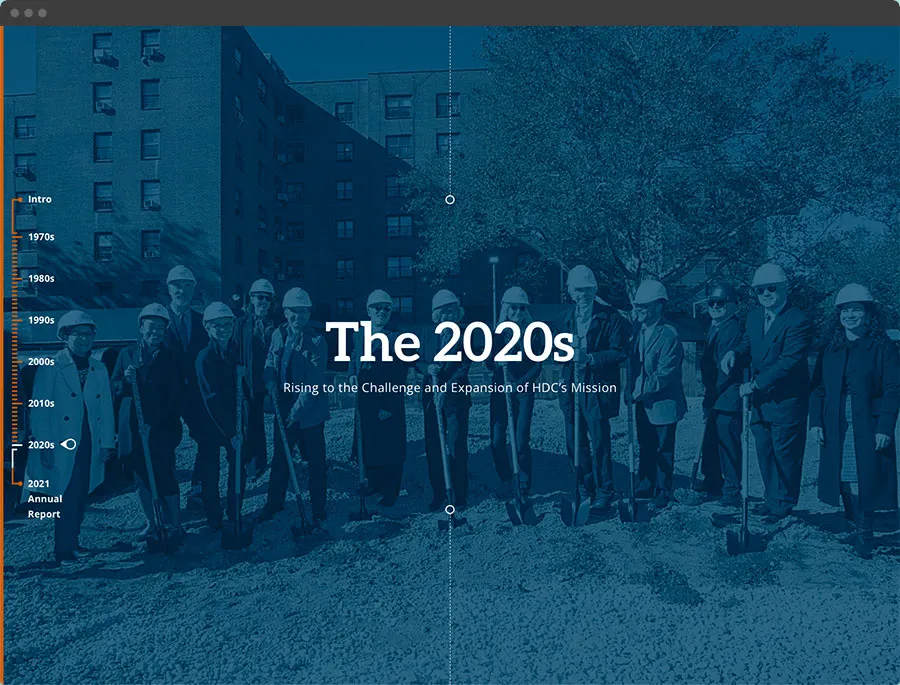
Focusing on the Year in Progress
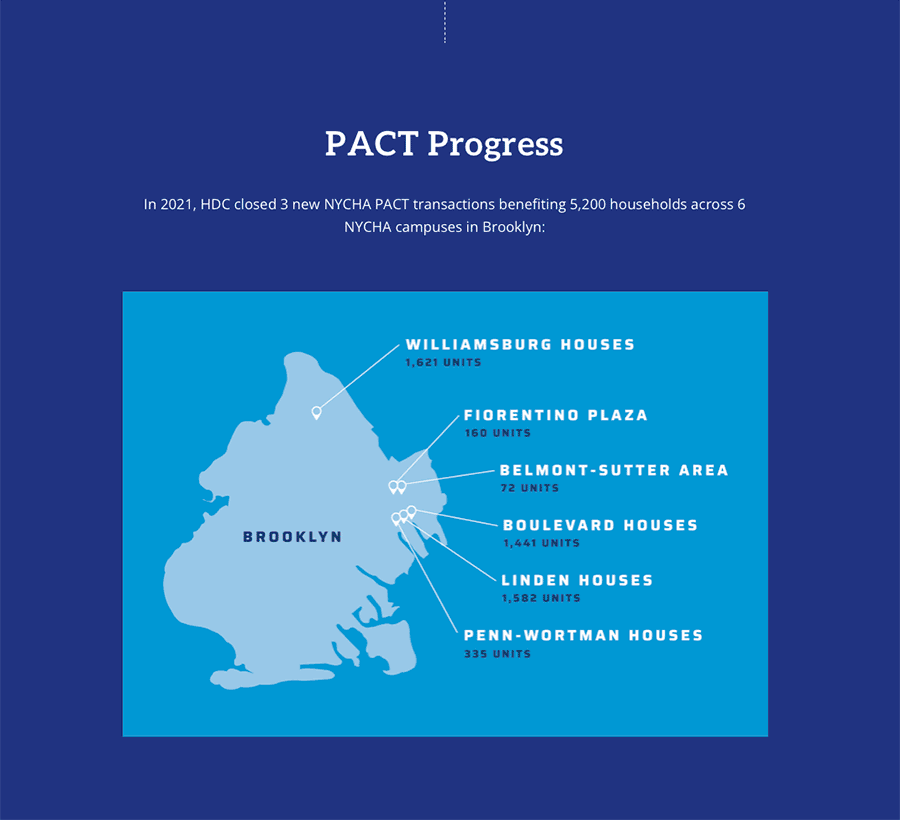
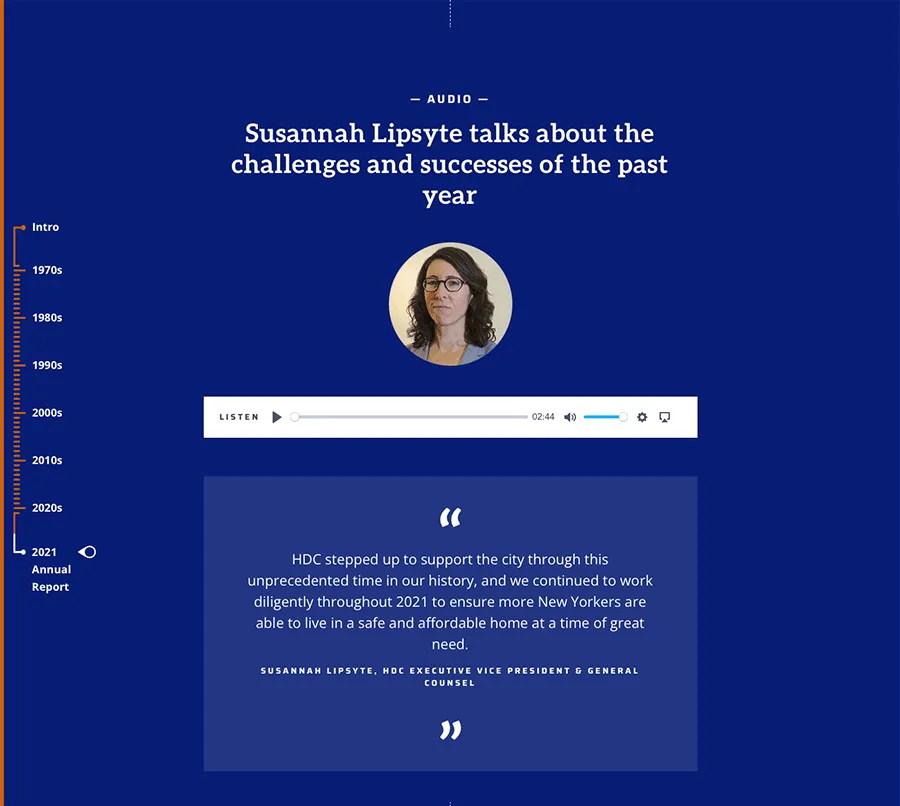
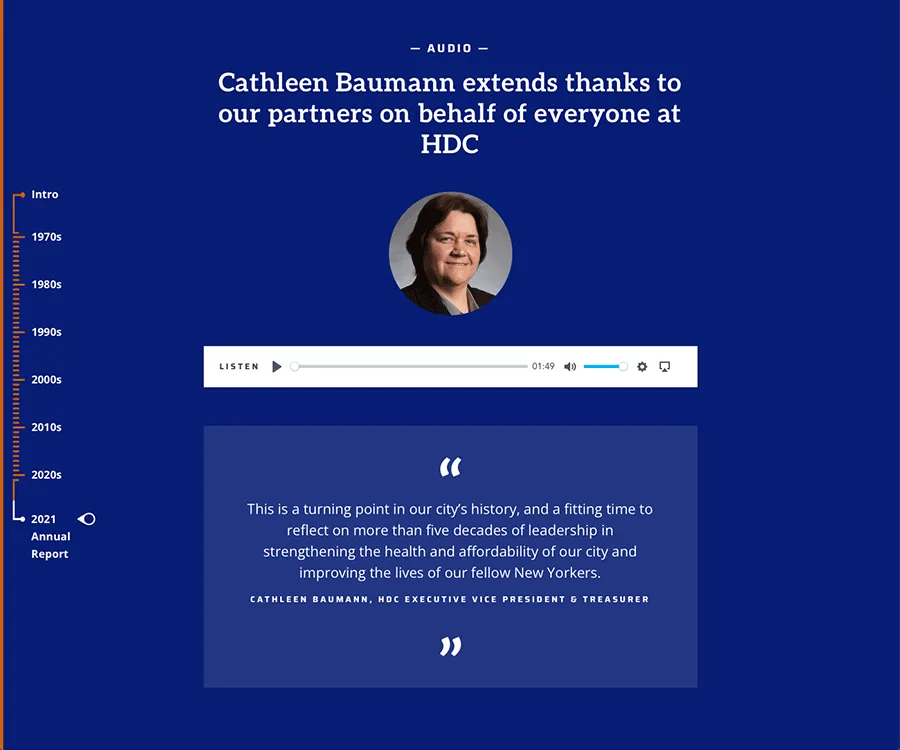
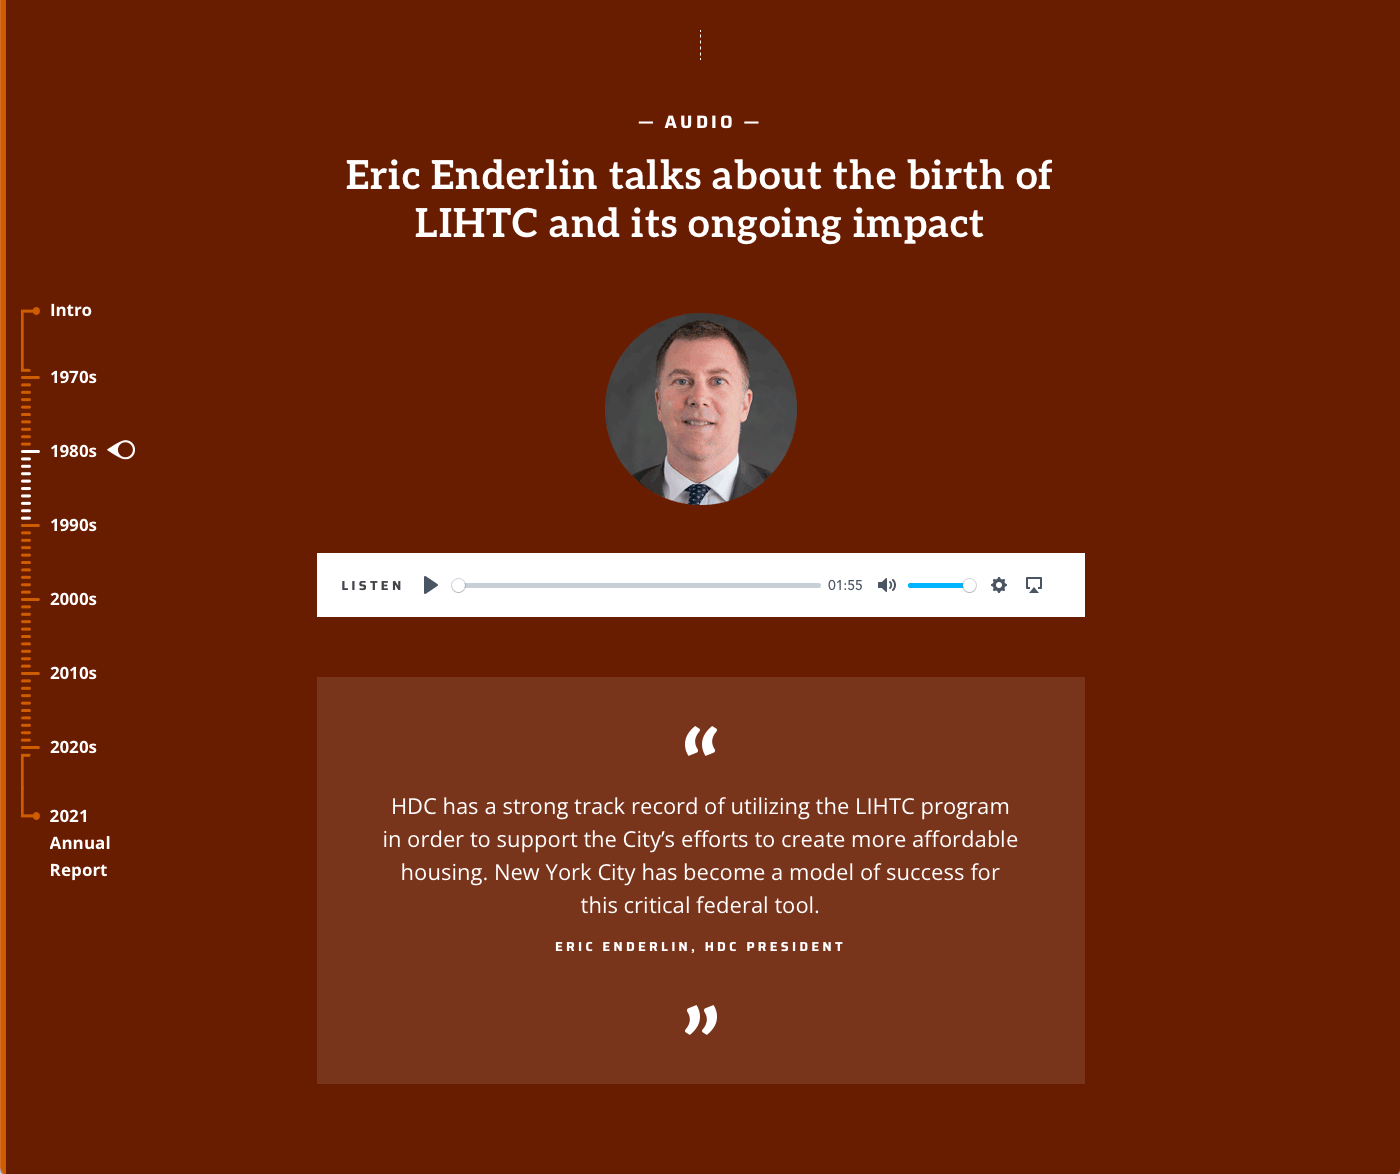
Within the broader timeline, the report brings the current year into focus with deeper, more detailed storytelling. Project highlights, before-and-after comparisons, and leadership audio provide a closer look at how HDC’s work shows up on the ground.
Data summaries and featured developments illustrate the scale of activity in 2021, connecting individual projects to overall impact. The result is a section that complements the long-term view with a clear, tangible understanding of what the work looks like today.