If you’re driving and need to know how many miles there are to the nearest airport, a sign will tell you. When walking through the downtown district of any major city, signs will let you know where key landmarks are. These information graphics are simple yet powerful.
Information graphics can also be a powerful tool for your brand. They can help make your case and move people to action. To be successful in transforming your data into accessible information that resonates, here are some guidelines we recommend…
Find the Meaning Behind the Numbers
First, you’ll need to put on your boots and do a little digging. Mine the data. Take a close look at it and see what it’s really telling you. Let’s say you sell sustainable home goods… Sales are up and you have a burgeoning base of satisfied customers. As you analyze your reports, you discover that the villages in Thailand where your materials are sourced from, are experiencing decreases in unemployment, lower crime rates and increased demand for educational services. Find the connections. Think like a Hollywood writer. Every good story has a beginning, middle and an end. Look at every facet of your organization from sales to operations to manufacturing and show folks how you’re making an impact.
Identify Who You’re Trying to Reach
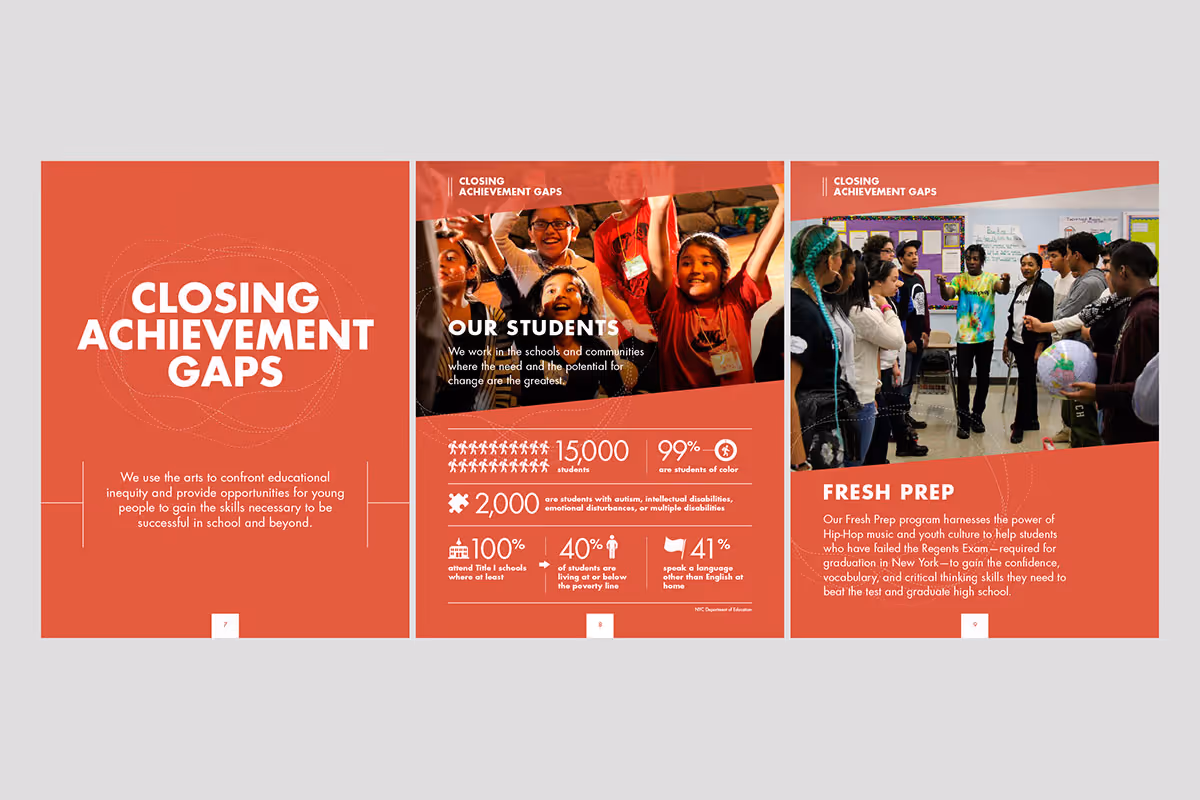
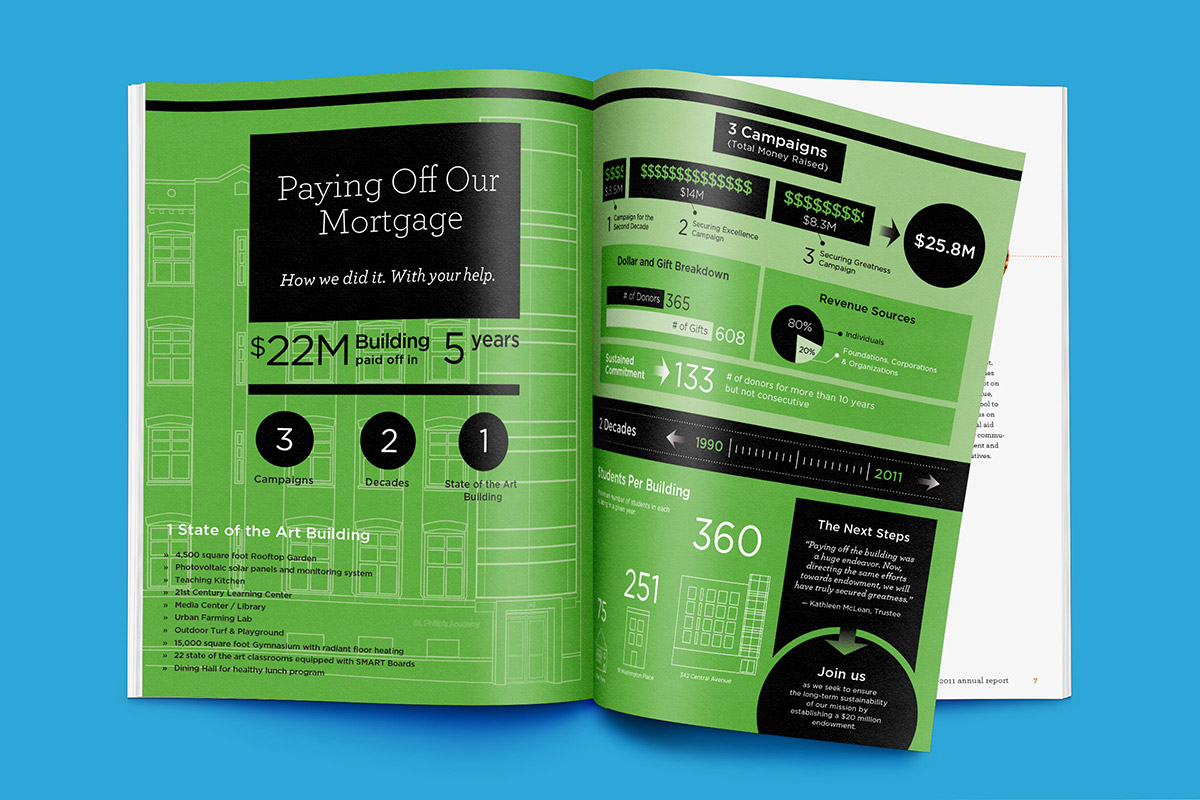
All your data won’t be relevant to all of your audience. Which segment(s) of your audience are you trying to reach? Are you fundraising? Perhaps you’re looking to raise additional capital for your socially minded business. For St. Philip’s Academy’s Annual Report, we developed two sets of infographics. The first set celebrated the accomplishments donors had helped achieve and the second demonstrated the need for continued support. It’s vital to understand what’s most important to the people who help you grow. Do your research. Find out what they value and will respond to.
The purpose of infographics is to make the complex simple. Avoid cognitive overload.
Make New Friends
Perhaps the most exciting aspect of social media is that it provides you with the opportunity to attract new supporters to your cause. Let’s say your non-profit helps autistic children. By using the hashtag #autism to search on Twitter, you can discover other people and groups who can help you in your mission. Use hashtags and keywords to find like-minded folks who care about what you do and reach out to them.
Keep It Simple
If you do have complex data that you’re dealing with, you’ll need to refine it. Edit. Cut. Reduce. Try highlighting just a specific aspect of the data you’re dealing with. The purpose of infographics is to make the complex simple. Avoid cognitive overload. You don’t have to share every single detail of the numbers, just its most essential elements.
Take some time to work out different concepts and approaches. Do some testing. Make it a team exercise and get feedback. Put yourself in your audience’s shoes. Is it clear? Do they get it? Would it make them want to take the actions you’d like them to?
Know Your Platform
What communications will you use to share your infographics? Web, print, mobile, social media or all of the above? Before you begin creating the information graphics, determine the platforms you’ll utilize. This will help guide how the infographics are developed. You don’t want to try to retrofit them after the fact as this would probably result in a total re-design.
Use, Re-use and Use Again
Maximize the potential of your infographics by sharing them on your website, in e-mail messages, slide presentations, in video and on all of your social media platforms.
Have fun uncovering the different aspects of your brand’s story and make some noise!